DIAGRAMS AND PHOTOMETRIC DATA
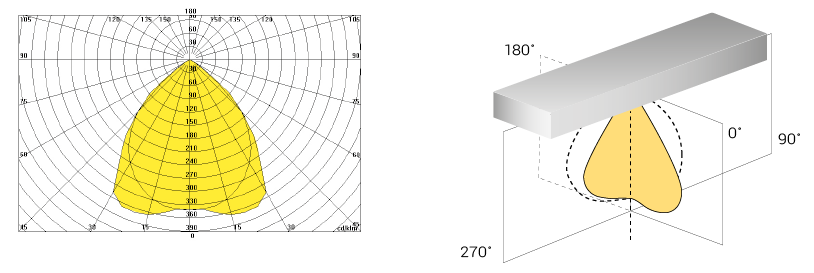
POLAR DIAGRAM
The group of endless segments that trace the lighting intensity of a source in each point of its surface create the so-called photometric solid. The polar diagram represents the distribution of lighting intensity along two main planes: crossway (0° – 180°) and lengthways (90° – 270°). The values are measured in cd/m2.
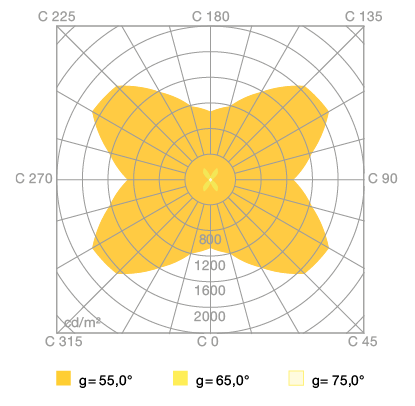
POLAR GLARE DIAGRAM
This diagram shows the luminance on a polar basis with Cartesian axes 0°-180° and 90°- 270°. It shows the luminance values for angles of 55°, 65° and 75° respect to the vertical. On the basis of standard 12464-1, it is the reference graph for measuring glare.