Technical lighting notions
CYLINDRICAL ILLUMINANCE AND MODELLING
Cylindrical illuminance and modelling are two indexes important for visual comfort.
The cylindrical illuminance is aimed at guaranteeing an optimum luminance of all solid objects, people’s faces in particular.
Therefore an adequate mean cylindrical illuminance value must be guaranteed in all areas where people move.
The mean cylindrical illuminance values must not be lower than 50lx on a plane at a height of 1.2m for seated persons and of 1.6m for standing persons above floor level.
In all rooms where an optimum visual communication is required (e.g. offices, classrooms, meeting rooms), the mean cylindrical illuminance must not be lower than 150lx. Illuminance uniformity must not be lower than 0.1 in both cases.
Modelling instead is the balance between diffuse and directional light. The modelling index is the ratio of cylindrical to horizontal illuminance on the same measuring point of the grid. An adequate modelling value ranges between 0.3 and 0.6 in case of a uniform distribution of the lighting fixtures or of a luminous ceiling.
The negative effects of a poor modelling value can be counterbalanced by daylight. Therefore modelling values not included in the above range may also be accepted.
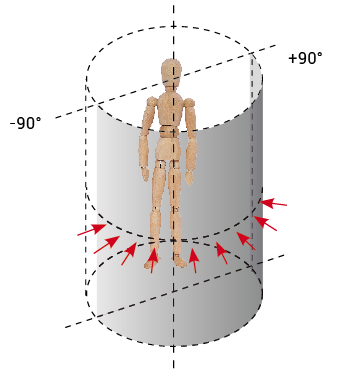
Cylindrical illuminance is the mean value of vertical illuminance rotating around a certain measuring point.
The cylindrical illuminance is aimed at guaranteeing an optimum luminance of all solid objects, people’s faces in particular.
Therefore an adequate mean cylindrical illuminance value must be guaranteed in all areas where people move.
The mean cylindrical illuminance values must not be lower than 50lx on a plane at a height of 1.2m for seated persons and of 1.6m for standing persons above floor level.
In all rooms where an optimum visual communication is required (e.g. offices, classrooms, meeting rooms), the mean cylindrical illuminance must not be lower than 150lx. Illuminance uniformity must not be lower than 0.1 in both cases.
Modelling instead is the balance between diffuse and directional light. The modelling index is the ratio of cylindrical to horizontal illuminance on the same measuring point of the grid. An adequate modelling value ranges between 0.3 and 0.6 in case of a uniform distribution of the lighting fixtures or of a luminous ceiling.
The negative effects of a poor modelling value can be counterbalanced by daylight. Therefore modelling values not included in the above range may also be accepted.
Cylindrical illuminance is the mean value of vertical illuminance rotating around a certain measuring point.
MEAN LUMINANCE LIMITS OF LUMINAIRES PRODUCING REFLECTIONS ON SCREENS
According to 12464-1:2011 standard the maximum luminance values for lighting fixtures that produce veiling reflections on screens (LCD) due to their position must be lower than the values indicated in the table below:
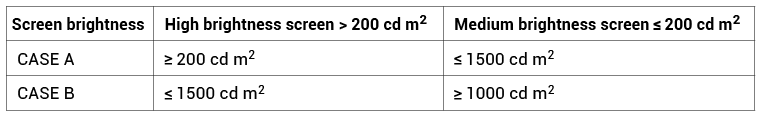
Case A refers to positive polarity flat screens with standard settings for colour and information displayed (e.g. offices, schools, etc.).
Case B refers to negative polarity flat screens and/or screens with high quality features concerning colour settings and details of the information displayed (e.g. CAD, colour inspection).
In case of a high brightness screen used with less than 200 cd m2, provisions concerning medium brightness screens should be followed.
The screen brightness represents the maximum brightness of the white parts of the screen. This value is indicated by the manufacturer. Some activities, visual tasks or technologies using extremely glossy screens might require different light conditions.
TECHNICAL LIGHTING NOTIONS: LIGHT FLOW AND LIGHTING EFFICIENCY
The light flow is the amount of light given off by a light source in an arc of time. The unit of measure is a lumen (lm). From the relationship of the light flow and the power used (W), the lighting efficiency is established, which is a fundamental indicator in establishing energy savings. The following table shows some fundamental data for the main types of lamps on sale.
WALL AND CEILING ILLUMINANCE
The 12464-1:2002 standard did not contain any provisions concerning these surfaces whilst the 12464-1:2011 standard establishes that mean illuminance should be:
for walls: > 50 lx with U0 ≥ 0.10
for ceilings: > 30 lx with U0 ≥ 0.10
The reasons for the introduction of this provision are based upon the fact that both walls and ceiling are included in the observer’s field of view (also called background) and are therefore of the utmost importance for the environment visual comfort.
The standard moreover specifies that a lower illuminance level may be accepted should the above-mentioned level not be complied with due to the dimensions and the complexity of the rooms or to operational factors.
For example, poor mean illuminance values are accepted in case of high ceilings with suspended lighting fixtures located far from the ceiling.
For rooms where visual activities or tasks require luminous surfaces, such as offices, schools and hospitals, the mean illuminance values should be 75lux for walls and > 50 lux for ceilings. For both uniformity must be equal to U0 ≥ 0.10.
ILLUMINANCE UNIFORMITY
Table 5 shows both the uniformity of the task area and the compulsory illuminance value per each task.
The minimum illuminance uniformity value for immediate surrounding areas is 0.4 whilst for background areas is 0.1.
The minimum illuminance uniformity value for immediate surrounding areas is 0.4 whilst for background areas is 0.1.
MAINTENANCE FACTOR
12464-1:2001 standard states that as far as the lighting equipment maintenance factor is concerned CIE 97:2005 (2nd edition) should be taken into consideration. It is calculated using the following formula:
MF=LLMFxLSFxLMFxRSMF
Where:
MF = maintenance factor.
LLMF = % of the physical luminous flux degradation of a lamp.
LSF = lamp survival factor expressed in %, i.e. the number of lamps still functioning after a certain period of time.
LMF = luminaire maintenance factor: % of luminous flux degradation of the luminaire over time.
RSMF = room surface maintenance factor is the % of degradation of light from reflective surfaces of a room over time.
VARIABILITY OF LIGHT
12464-1:2011 standard further highlights the importance of light for people’s health and wellbeing. It affects mood, attention and circadian rhythms as well as the psychophysical and psychological states. The recommended variation range has not been decided yet.
TECHNICAL LIGHTING NOTIONS: LIGHT INTENSITY, LUMINANCE AND ILLUMINATION
Two fundamental measurements are given by the light flow: illumination and lighting intensity, which should be explained to prevent confusion.
Lighting intensity (I), is expressed in candles (cd), measures the amount of flow in a punctiform light source in a specific direction, no matter what surface or object is being illuminated; illumination however, oriented for technical lighting design and considered by UNI10380 standards, measures the amount of light for unit of surface.
Considering that the set unit of measure is lux (lx) and that normally we refer to a surface area of 1m2, the formula is:
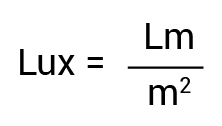
As the lighting source is not punctiform, the concept of luminance has been introduced (L) i.e. the relationship between lighting intensity issued and the issuing surface, expressed in cd/m2.
Lighting intensity (I), is expressed in candles (cd), measures the amount of flow in a punctiform light source in a specific direction, no matter what surface or object is being illuminated; illumination however, oriented for technical lighting design and considered by UNI10380 standards, measures the amount of light for unit of surface.
Considering that the set unit of measure is lux (lx) and that normally we refer to a surface area of 1m2, the formula is:
As the lighting source is not punctiform, the concept of luminance has been introduced (L) i.e. the relationship between lighting intensity issued and the issuing surface, expressed in cd/m2.
TECHNICAL LIGHTING NOTIONS: COLOUR TEMPERATURE and CHROMATIC YIELD
COLOUR TEMPERATURE
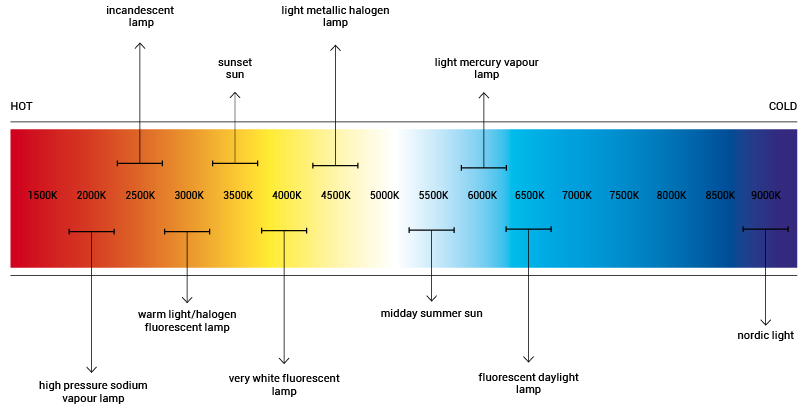
The colour temperature of a light source is based on the principle that an incandescent item changes colour as the temperature increases. The theoretic principle this measurement is based on is the “radiating black body”. As the temperature increases, the black body gradually changes from red to orange, to yellow, to white to finally reach white-sky blue.
This measurement is expressed in Kelvin degrees (K). The following diagram shows its trend:
CHROMATIC YIELD
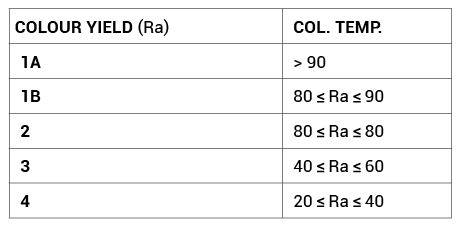
The chromatic yield of light source corresponds to the ability to recognise the colours of an exposed item.
This need varies with the item: generally it is more marked for multi-coloured items and lower in monochrome items.
The chromatic yield indicator (Ra) is a system that has been derived from vision experiments to assess the impact exercised by different light sources on the colour that is perceived of items and surfaces.
First of all the colour temperature of the light source must be identified. Secondly, eight sample colours are lit by the lamp being studied, and the results are compared with those of a “black body” which has been taken to the same colour temperature. If none of the samples change chromatically, the light source is recognised an Ra of 100. As the performance worsens a lower mark is granted. Generally speaking, light sources with an Ra equal or higher than 80 are assigned good chromatic yield properties.
The colour temperature of a light source is based on the principle that an incandescent item changes colour as the temperature increases. The theoretic principle this measurement is based on is the “radiating black body”. As the temperature increases, the black body gradually changes from red to orange, to yellow, to white to finally reach white-sky blue.
This measurement is expressed in Kelvin degrees (K). The following diagram shows its trend:
CHROMATIC YIELD
The chromatic yield of light source corresponds to the ability to recognise the colours of an exposed item.
This need varies with the item: generally it is more marked for multi-coloured items and lower in monochrome items.
The chromatic yield indicator (Ra) is a system that has been derived from vision experiments to assess the impact exercised by different light sources on the colour that is perceived of items and surfaces.
First of all the colour temperature of the light source must be identified. Secondly, eight sample colours are lit by the lamp being studied, and the results are compared with those of a “black body” which has been taken to the same colour temperature. If none of the samples change chromatically, the light source is recognised an Ra of 100. As the performance worsens a lower mark is granted. Generally speaking, light sources with an Ra equal or higher than 80 are assigned good chromatic yield properties.
DIAGRAMS AND PHOTOMETRIC DATA
POLAR DIAGRAM
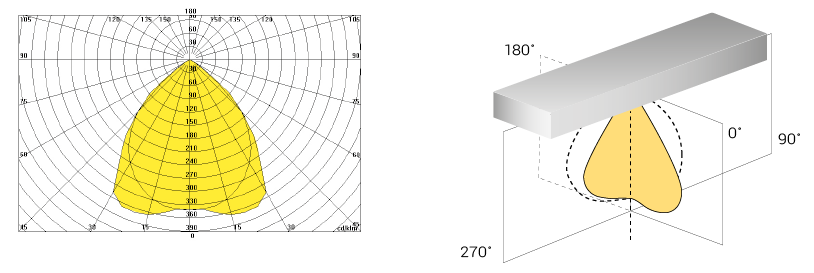
The group of endless segments that trace the lighting intensity of a source in each point of its surface create the so-called photometric solid. The polar diagram represents the distribution of lighting intensity along two main planes: crossway (0° - 180°) and lengthways (90° - 270°). The values are measured in cd/m2.
POLAR GLARE DIAGRAM
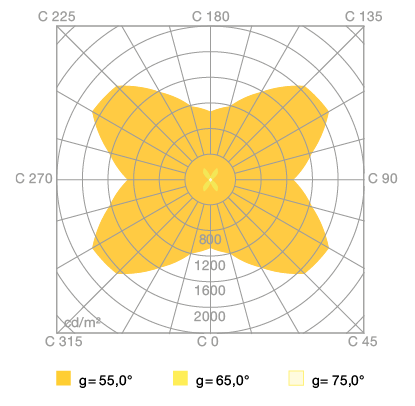
This diagram shows the luminance on a polar basis with Cartesian axes 0°-180° and 90°- 270°. It shows the luminance values for angles of 55°, 65° and 75° respect to the vertical. On the basis of standard 12464-1, it is the reference graph for measuring glare.
The group of endless segments that trace the lighting intensity of a source in each point of its surface create the so-called photometric solid. The polar diagram represents the distribution of lighting intensity along two main planes: crossway (0° - 180°) and lengthways (90° - 270°). The values are measured in cd/m2.
POLAR GLARE DIAGRAM
This diagram shows the luminance on a polar basis with Cartesian axes 0°-180° and 90°- 270°. It shows the luminance values for angles of 55°, 65° and 75° respect to the vertical. On the basis of standard 12464-1, it is the reference graph for measuring glare.
QUALITY RATING FOR LIGHTING PLANT
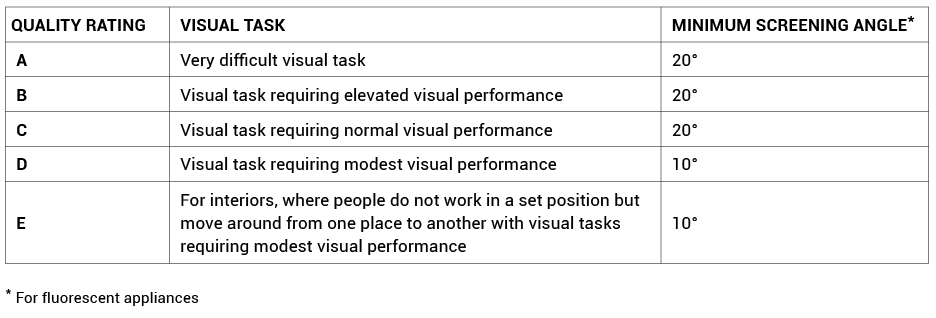
The quality ratings refer to the internal of the diagram. Curves that are on the lift of the straight line they represent are acceptable.
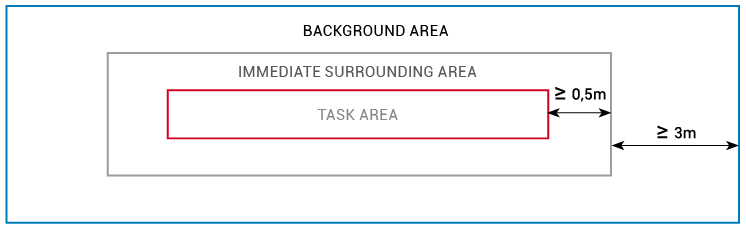
ILLUMINANCE OF THE IMMEDIATE SURROUNDING AREA
The definition of the immediate surrounding area remains unchanged: a band of at least 0.5m wide around the task area.
The illuminance values of this area are summed up in the table below:
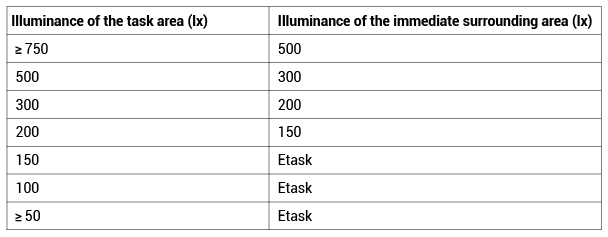
The illuminance values of this area are summed up in the table below:
BACKGROUND ILLUMINANCE
This parameter was introduced by the 12464-1:2011 standard. The background area consists of a band, at least 3m wide around the immediate surrounding area, and must have a mean illuminance value equal to 1/3 of the latter.
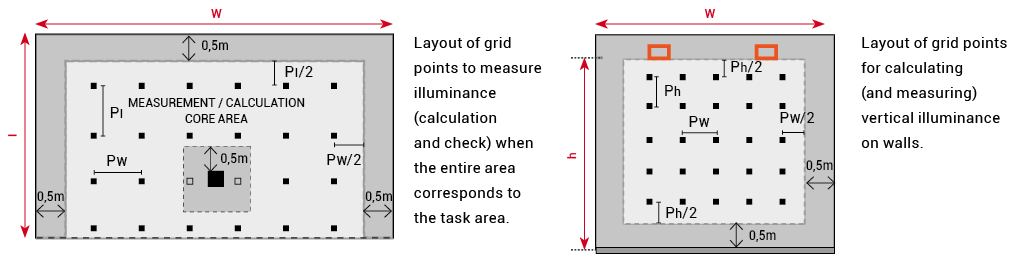
ILLUMINANCE GRIDS
Unlike 12464-1:2002 standard, 12461-1:2011 standard defines the minimum number of measuring points and the dimensions of the grid cells for the different task areas. Illuminance grids are defined according to UNI EN 12193 standard criteria and have the following characteristics:
The ratio of length to width of the grid cells ranges between 0.5 and 2.
Measuring points correspond to the barycentre of each cell.
The maximum size of a cell is calculated using the following formula:
p=0.2x5log10(d)
Where “p” is the grid cell size and can reach a maximum of 10m and “d” is the longer dimension of the area if the ratio of the longer to the shorter side is less than 2, otherwise “d” is the shorter dimension. “n” represents the total number of measuring points along the dimension “d”. It is the closest whole number greater than the ratio:
n= d/p
“p” is the result of the ratio:
p=d/n
The measuring points along the other side of the grid are calculated in the same way.
The ratio of one side to the other must be as close to 1 as possible. Illuminance grids must not include a band, at least 0.5m wide, from the walls unless the visual task is not carried out at a lower distance.